

Returns the average deviation from the mean of the X values in the list. It accepts no input value.
The result is calculated according to:
AveDevX = ∑|xn - MeanX| / N
This function is accessible from the [S-VAR] key. It can be used in either SD or X-Y modes. In SD mode, account is taken of frequency values.
Returns the average deviation from the mean of the Y values in the regression data list. It accepts no input value.
This function is accessible from the [S-VAR] key. It is not available in SD mode.
Calculates the coefficient A of the current regression mode formula. This function is accessible from the [S-DIST] key when the calculator is in one of the regression modes.
COEF_A accepts no input value, and the result is applicable to the regression formula used, as follows:
| Regression Mode (X-Y) | Formula |
|---|---|
| Linear | y = Ax + B |
| Logarithmic | y = A.ln(x) + B, for x > 0 |
| Exponential | y = A.eBx, for y > 0 |
| Power | y = AxB, for x & y > 0 |
| Inverse | y = A / x + B, for x not 0 |
| Quadratic Regression | y = Ax2 + Bx + C |
| Cubic Regression | y = Ax3 + Bx2 + Cx + D |
| Logistic Regression (Pro Only) | y = A / (1 + B.eCx) |
For an example calculation using regression, see Statistical Modes & List Data.
See also the COEF_B, COEF_C and COEF_D.
Calculates the coefficient B of the current regression mode formula. This function is accessible from the [S-DIST] key when the calculator is in one of the regression modes.
It accepts no input value.
See COEF_A for more information.
Calculates the coefficient C for those regression modes where a third coefficient is used, including quadratic, cubic and logistic regression.
It accepts no input value.
This function is accessible from the [S-DIST] key.
See COEF_A for more information.
Calculates the coefficient D for those regression modes where a forth coefficient is used, namely cubic regression. It accepts no input value.
This function is accessible from the [S-DIST] key.
See COEF_A for more information.
Calculates the correlation coefficient R for linear and regression modes supporting a linear transform model. It accepts no input value.
A correlation coefficient is a number between -1 and +1, which expresses the degree to which X and Y variables are related, either by a direct linear relationship or when the values are linearized by the transform model. If there is a perfect relationship with a positive slope, COEF_R returns +1. If there is a perfect relationship with negative slope, COEF_R returns -1. A correlation coefficient of 0 means that there is no relationship between the variables.
This function is accessible from the [S-DIST] key when the calculator is in one of these regression modes.
See also the RMSE, MAE, COEF_R2 and COVAR functions.
Calculates the coefficient of determination for linear and regression modes supporting a linear transform model. It accepts no input value.
The coefficient of determination is simply the square of the correlation coefficient COEF_R and is, thus, an unsigned value between 0 and +1 representing the 'goodness of fit'. Values greater than 0.64 are often considered to represent a good regression fit.
This function is accessible from the [S-DIST] key when the calculator is in one of these regression modes.
See also the RMSE, MAE, COEF_R and COVAR functions.
Copy RegEq simply copies the current regression formula to the Window's clipboard as a text string; it does not perform any mathematical operation.
Example
In Quadratic Regression mode press:
[S-DIST] and select Copy RegEq
The clipboard will now contain, "y = Ax^2 + Bx + C".
This option is accessible from the [S-DIST] key. It is not available in SD mode.
Calculates the covariance between the X and Y for linear and regression modes supporting a linear transform model. It accepts no input value.
COVAR provides a measure of the extent to which the X and Y values co-vary. Because the number representing covariance depends on the units of the data, it is often difficult to compare covariances among data sets of different scales. The correlation functions COEF_R and COEF_R2 address this problem.
This function is accessible from the [S-DIST] key when the calculator is in one of these regression modes.
See also the RMSE, COEF_R and COEF_R2 functions.
Pressing [DAT] appends the display value to the current statistical list, thus allowing the input of data via the main keypad.
To enter a value, simply key it in and press [DAT]. You should use the separator key [;] to enter paired values, for example:
45 [;] 3
[DAT]
In SD mode, this will enter a value of 45 with a frequency of 3, or an X-Y pair in regression modes. If you omit the frequency in SD mode, a value of 1 will be assumed. For large amounts of data, you will find it convenient to use the Graphing & List Window instead.
Note that [;] is also used to enter complex numbers, however, the input does not become complex until a calculation is performed.
Calculates y as a function of x, using the regression formula determined for the current X-Y data, where:
y = f(x)
This function is accessible from the [S-DIST] key, and is available only in X-Y modes.
Example:
[S-DIST] and select FofX
55
[ENTER]
Displays: 132.7733
See also the reverse FofY function, which calculates x as a function of y. See also Copy RegEq, and COEF_A to COEF_D.
Calculates x as a function of y, using the regression formula determined for the current X-Y data, where:
x = f(y)
Where multiple solutions exist for x, only one result is returned.
This function is accessible from the [S-DIST] key, and is available only in X-Y modes.
See also FofX, Copy RegEq, and COEF_A to COEF_D.
Calculates the kurtosis Gk of the SD list data. It accepts no input value.
Kurtosis is a measure of the "peakedness" of the data, and is defined by:
Gk = ∑(xn - MeanX)4 / (StdX[N-1]4 * (N-1))
Positive kurtosis indicates a "peaked" distribution and negative kurtosis indicates a "flat" distribution. A normal distribution of data has a kurtosis value of +3.
This function is accessible from the [S-DIST] key when the calculator is in SD statistical mode. It is not available in X-Y regression modes.
See also: Gs (skew).
Returns a random number with a standard normal distribution, i.e. with a mean of zero and standard deviation of one.
The GRAND function is to be found under the [NUM] key.
Example:
[NUM] and select GRAND
Displays: 0.547... (result is variable)
GRAND takes no input value.
Calculates the level of skew Gs of the SD list data. It accepts no input value.
Skewness is a measure of symmetry, or more precisely, the lack of symmetry. It is defined by:
Gs = ∑(xn - MeanX)3 / (StdX[N-1]3 * (N-1))
Positive skew indicates that the data distribution is skewed right. By skewed right, we mean that the right tail is long relative to the left tail. Whereas a negative value indicates data that are skewed left. The skewness of symmetric data, including a normal distribution, is zero.
This function is accessible from the [S-DIST] key when the calculator is in SD statistical mode. It is not available in X-Y regression modes.
See also: Gk (kurtosis).
Calculates the mean absolute error of y in the X-Y list. It accepts no input value.
MAE provides a measure of the error in the regression fit using the same units as those of the y-axis, and is calculated according to:
MAE =∑|yn - FofX(xn)| / N
Where: FofX() gives the y value of the line of best fit, as a function of x, for the current regression mode.
This function is accessible from the [S-DIST] key and can be used in X-Y modes only.
Unlike COEF_R and COEF_R2, MAE can be used in all regression modes, including quadratic, cubic and logistic regression.
See also RMSE.
Returns the maximum X value in the list. It accepts no input value.
This function is accessible from the [S-SUM] key. It can be used in either SD or X-Y modes.
See also MinX and RangeX.
Returns the maximum Y value in the regression data list. It accepts no input value.
This function is accessible from the [S-SUM] key. It is not available in SD mode.
Returns the mean of the X values in the list. It accepts no input value.
This function is accessible from the [S-VAR] key. It can be used in either SD or X-Y modes. In SD mode, account is taken of frequency values.
Returns the mean of the Y values in the regression data list. It accepts no input value.
This function is accessible from the [S-VAR] key. It is not available in SD mode.
Returns the median (the mid-value of the data), calculated for the X values in the list. It accepts no input value.
This function is accessible from the [S-DIST] key in SD mode only.
See also ModeX.
Returns the minimum X value in the list. It accepts no input value.
This function is accessible from the [S-SUM] key. It can be used in either SD or X-Y mode.
See also MaxX and RangeX.
Returns the minimum Y value in the regression data list. It accepts no input value.
This function is accessible from the [S-SUM] key. It is not applicable in SD mode.
Returns the most frequent value in the list of discrete data. It accepts no input value.
For example, given the values 1, 2, 3, 3, 4, with all frequencies 1, the result of ModeX will be 3 as this value appears twice. If no most frequent value exists, a math error will be given. For example, the values 1, 2, 3, 4 will give an error because no single value appears more than any other.
This function is accessible from the [S-DIST] key in SD mode only.
See also MedianX.
Returns the sum of the frequency values in the list. It accepts no input value.
In SD mode, the result is the sum of frequencies. If all frequency values are 1, the result is simply the number of data values. In X-Y modes, the result is always the data count.
The N function is accessible from the [S-SUM] key. It can be used in either SD or X-Y regression modes.
Given an input value z, the PG function returns the integral of the standard Gaussian curve over the range [-INF, z]. This function is found on the main keypad, and is independent of the statistical mode and data list.
The result is the area shown under the curve below, and represents the probability for the range -INF to z, where z is expressed in terms of a normalized variate (the number of standard deviations from the mean).
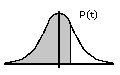
Gaussian Probability PG
Example:
Given the following sample data, estimate the probability of observing sample values less than 8.8. Assume that the data is normally distributed.
10.88 10.25 10.2 8.71 11.23 10.88 12.33 10.67 9.96 9.08 8.76 |
9.23 10.56 11.09 10.7 11.08 9.84 9.59 8.22 9.89 10.6 10.61 |
9.12 9.6 10.58 9.11 10.02 10.51 10.96 11.11 9.85 8.95 10.16 |
10.11 9.39 9.28 10.27 9.52 9.1 10.1 9.65 8.48 9.47 10 |
Sample Measurement Values
Ensure that DreamCalc is in SD statistical mode, and key in the above data.
In prefix algebraic input mode, enter:
[PG] (probability from -INF to z)
[S-DIST] and select Z (normalized variate)
8.8
[ENTER]
Displays: 0.081034 (probability result)
DreamCalc employs a numerical integration technique to calculate PG. Input values of -5 or less will give 0, while inputs of +5 or more will return +1. Otherwise, the result is accurate to the number of digits shown.
Given an input value z, the QG function returns the integral of the standard Gaussian curve over the range [0, z]. This function is found on the main keypad, and is independent of the statistical mode and data list.
The result is the area shown under the curve below, and represents the probability for the range 0 to z, where z is expressed in terms of a normalized variate (the number of standard deviations from the mean).
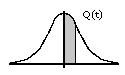
Gaussian Probability QG
DreamCalc employs a numerical integration technique to calculate QG. Input values of -5 or less, or +5 or more, will both give 0.5. Otherwise, the result is accurate to the number of digits shown.
Given an input value z, the RG function returns the integral of the standard Gaussian curve over the range [z, +INF]. This function is found on the main keypad, and is independent of the statistical mode and data list.
The result is the area shown under the curve below, and represents the probability for the range z to +INF, where z is expressed in terms of a normalized variate (the number of standard deviations from the mean).
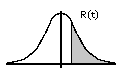
Gaussian Probability RG
DreamCalc employs a numerical integration technique to calculate RG. Input values of -5 or less will give +1, while inputs of +5 or more will return 0. Otherwise, the result is accurate to the number of digits shown.
Returns the difference between the maximum and minimum X values in the list. It accepts no input value.
This function is accessible from the [S-SUM] key. It can be used in either SD or X-Y regression modes.
See also MaxX and MinX.
Returns the difference between the maximum and minimum Y values in the X-Y data list. It accepts no input value.
This function is accessible from the [S-SUM] key. It is not applicable in SD mode.
See also MaxY and MinY.
Calculates the root mean square error of y in the X-Y list. It accepts no input value.
RMSE provides a measure of the error in the regression fit using the same units as those of the y-axis, and is calculated according to:
RMSE = √( ∑(yn - FofX(xn))2 / N )
Where: FofX() gives the y value of the line of best fit, as a function of x, for the current regression mode.
This function is accessible from the [S-DIST] key and can be used in X-Y modes only.
Unlike COEF_R and COEF_R2, RMSE can be used in all regression modes, including quadratic, cubic and logistic regression.
See also MAE.
The [S-DIST] key provides input, via an on-screen menu, of functions related to distribution calculations.
For SD mode, functions include: Z, ModeX, Median, Skew Gs and Kurtosis Gk. For X-Y modes, functions include: coefficients, functions FofX and FofY, RMSE, covariance etc.
Note. Press this key repeatedly times to page through all available functions.
Returns the population standard deviation of the values in the list. It accepts no input value.
The result is calculated according to:
StdX[N] = √( ∑(xn - MeanX)2 / N )
Standard deviation is a measure of how widely spread the values in of data set are. For normally distributed data, one standard deviation equates to a range around the mean where the probability of observing a value is approximately 68.27%.
This function is accessible from the [S-VAR] key and can be used both SD and X-Y modes. In SD mode, account is also taken of frequency values. StdX[N] accepts no input value.
See also the StdX[N-1] function.
Returns the population standard deviationof the Y values in the X-Y list. It accepts no input value.
This function is accessible from the [S-VAR] key. It is applicable in X-Y modes only.
See also StdX[N].
Returns the sample standard deviation of the values in the list. It accepts no input value.
The result is calculated according to:
StdX[N-1] = √( ∑(xn - MeanX)2 / (N-1) )
Standard deviation is a measure of how widely spread the values in of data set are. For normally distributed data, one standard deviation equates to a range around the mean where the probability of observing a value is approximately 68.27%.
This function is accessible from the [S-VAR] key and can be used both SD and X-Y modes. In SD mode, account is also taken of frequency values.
See also the StdX[N] function.
Returns the calculated sample standard deviation of the Y values in the X-Y list. It accepts no input value.
This function is accessible from the [S-VAR] key. It is applicable in X-Y modes only.
See also StdX[N-1].
Returns the calculated standard error of the mean of values in the list. It accepts no input value.
The result is calculated according to:
StdErrX = StdX[N-1] / √N
The standard error of the mean describes the probable error associated with the sample mean. It is a measure of how close the sample mean is likely be to the true or population mean.
This function is accessible from the [S-VAR] key and can be used both SD and X-Y modes. In SD mode, account is also taken of frequency values.
Returns the calculated standard error of the Y values in the X-Y list. This function is accessible from the [S-VAR] key. It is applicable in X-Y modes only. See also StdErrX.
The [S-SUM] key provides input, via an on-screen menu, of functions related to sums and ranges of the data.
Functions include: SumX, SumX2, MinX, MinX, and RangeX etc. Equivalent functions are available for Y value calculations in X-Y modes.
Note. Press this key repeatedly times to page through all available functions.
Returns the sum of all x values in the list. It accepts no input value.
This function is accessible from the [S-SUM] key, and can be used in either SD or X-Y mode. In SD mode, account is taken of frequency values.
Returns the sum of the squares of x values in the list. It accepts no input value.
This function is accessible from the [S-SUM] key. It can be used in either SD or X-Y mode. In SD mode, account is taken of frequency values.
Returns the sum of the X-Y products in the regression data list. It accepts no input value.
This function is accessible from the [S-SUM] key. It is not available in SD mode.
Returns the sum of all y values in the regression data list. It accepts no input value.
This function is accessible from the [S-SUM] key. It is not available in SD mode.
Returns the sum of the squares of y values in the regression data list. It accepts no input value.
This function is accessible from the [S-SUM] key. It is not available in SD mode.
The [S-VAR] key provides input, via an on-screen menu, of functions related to mean and variance calculations.
Functions include: MeanX, StdX[N], StdX[N-1], StdErrX. Equivalent functions are available for Y value calculations in X-Y modes.
Note. Press this key repeatedly times to page through all available functions.
Calculates the normalized variate Z given an input value, using the data in the SD list.
The normalized variate is the number of standard deviations between the mean and the input value x, as calculated with the following equation:
Z = (x - MeanX) / StdX[N-1]
The calculation assumes that the data is normally distributed. See the PG function for an example of a calculation using the normalized variate.
This function is accessible from the [S-DIST] key when the calculator is in SD statistical mode. It is not available in X-Y regression modes.
Returns the two-sided z-value, sometimes known as the standard score or z-score, given a confidence level input in the range (-1, 1). This function is found on the main keypad, and is independent of the statistical mode and data list.
A z-value is equal to a Student t-value for an infinite degree of freedom, and can be used as an approximate of a t-value provided it is used in connection with a calculation using a large sample (typically above 30).
For example, provided the number of values used to calculate StdErrX is considered large, the following input gives the confidence interval of the mean:
[zs] (z-score function above the [;] key)
0.9 (90% confidence as fraction)
[×]
[S-VAR] and select StdErrX
[ENTER]
Displays: 0.21161705529476782 (result depends on SD list contents)
In general, if the number of samples under consideration is less than 30, the z-value should not be used.
It is common to define the confidence level in terms of an alpha value, or risk of error. In this case, r = (1 - alpha), as follows:
zs(r) = zs(1 - alpha)
and examples include:
zs(0.90) = zs(1 - 0.1) = 1.6449 (90% confidence, or 10% risk)
zs(0.95) = zs(1 - 0.05) = 1.96 (95% confidence, or 5% risk)
zs(0.99) = zs(1 - 0.01) = 2.5758 (99% confidence, or 1% risk)
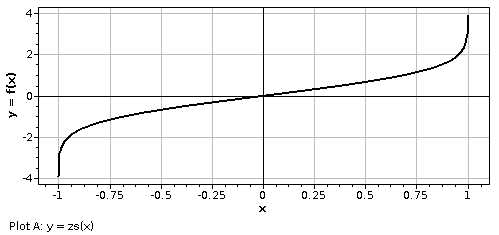
Note that, where inputs values are close to -1 or +1 (ie. 0.99999999999), the result will be considered to approximate infinity and DreamCalc with give "range error". Otherwise, the result is accurate to the number of digits shown.
The plot below shows zs(r) over the input range (-1, 1).
Where a one-sided z-value is required, the following simple relation can be applied:
zone-sided = zs(2*r - 1)
For example, we can calculate a one-sided 90% z-score using prefix algebraic input, as follows:
[zs]
[(]
2
[×]
0.9 (90% confidence)
[-]
1
[)]
[ENTER]
Displays: 1.2816 (one-sided result for 90% confidence)
You may also wish to note that you can perform the reverse of zs(r) using the DreamCalc QG(z), by way of the following relation:
2 * QG( zs(r) ) = r (two-sided interval)
and the following is applicable for a one-sided interval:
PG( zs(2*r - 1) ) = r (one-sided interval)
See also QG, PG, RG and Z.
See also: Statistical Calculations